SAVI Calculator
Block type: PROCESSING
This block takes photos from an optical satellite and calculates Soil Adjusted Vegetation Index (SAVI). It produces georeferenced raster output, which can be inspected visually or used for further processing. The output can be opened in GIS tools like QGIS or ArcGIS.
Supported parameters
colormap- the colormap, which will be used in rendering. See section Colormap for valid values.L- the soil adjustment factor (suggested values are between -0.9 and 1.6).satellite- the name of the block providing input data. See section Supported data blocks for valid values.
Example parameters using Sentinel-2 Level 2 (BOA) AOI clipped block as data source and then rendering SAVI with RdYlGn colormap and soil adjustment factor set to 0.2:
{
  "sentinelhub-s2-aoiclipped:1": {
    "time": "2018-05-07T16:47:48+00:00/2018-05-09T16:47:49+00:00",
    "limit": 1,
    "intersects": {
      "type": "Polygon",
      "coordinates": [
        [
          [
            18.726196,
            53.473489
          ],
          [
            18.720531,
            53.479312
          ],
          [
            18.708215,
            53.476043
          ],
          [
            18.719931,
            53.468431
          ],
          [
            18.73332,
            53.466183
          ],
          [
            18.739586,
            53.471854
          ],
          [
            18.726196,
            53.473489
          ]
        ]
      ]
    },
    "zoom_level": 14
  },
  "qzsolutions.savi:1": {
    "colormap": "RdYlGn",
    "L": 0.2,
    "satellite": "Sentinel-2 Level 2 (BOA) AOI clipped"
  }
}
Supported data blocks
Currently this block supports input from data blocks:
Landsat-8 Level 1 (TOA) AOI clipped
To see this block on up42 please click here.
Sample block parameters when using Landsat-8 Level 1 (TOA) AOI clipped data block:
{
  "colormap": "RdYlGn",
  "L": -0.2,
  "satellite": "Landsat-8 Level 1 (TOA) AOI clipped"
}
Pléiades Download
To see this block on up42 please click here.
Sample block parameters when using Pléiades Download data block:
{
  "colormap": "RdYlGn",
  "L": 0.2,
  "satellite": "Pleiades Download"
}
Warning
Please notice that satellite parameter does not contain ‘é’ character but ‘e’.
Sentinel-2 L1C MSI Full Scenes
To see this block on up42 please click here.
Sample block parameters when using Sentinel-2 L1C MSI Full Scenes data block:
{
  "colormap": "RdYlGn",
  "L": 0,
  "satellite": "Sentinel-2 L1C MSI Full Scenes"
}
Sentinel-2 Level 2 (BOA) AOI clipped
To see this block on up42 please click here.
Sample block parameters when using Sentinel-2 Level 2 (BOA) AOI clipped data block:
{
  "colormap": "RdYlGn",
  "L": -0.5,
  "satellite": "Sentinel-2 Level 2 (BOA) AOI clipped"
}
SPOT 6/7 Download
To see this block on up42 please click here.
Sample block parameters when using SPOT 6/7 Download data block:
{
  "colormap": "RdYlGn",
  "L": 0.5,
  "satellite": "SPOT 6/7 Download"
}
Output format
The block produces a feature collection with up42.data_path property containing a name of the result file.
Contents of data.json file returned by a block configured in the previous example:
{
  "type": "FeatureCollection",
  "features": [
    {
      "type": "Feature",
      "bbox": [
        18.69873046875,
        53.46189043285912,
        18.74267578125,
        53.48804553605621
      ],
      "geometry": {
        "type": "Polygon",
        "coordinates": [
          [
            [
              18.720703125,
              53.46189043285912
            ],
            [
              18.69873046875,
              53.46189043285912
            ],
            [
              18.69873046875,
              53.47496999954854
            ],
            [
              18.69873046875,
              53.48804553605621
            ],
            [
              18.720703125,
              53.48804553605621
            ],
            [
              18.74267578125,
              53.48804553605621
            ],
            [
              18.74267578125,
              53.47496999954854
            ],
            [
              18.74267578125,
              53.46189043285912
            ],
            [
              18.720703125,
              53.46189043285912
            ]
          ]
        ]
      },
      "properties": {
        "up42.data_path": "63ca5877-117e-497f-9a49-a264b2a3ca23.tiff",
        "acquisitionDate": "2018-05-08T09:50:28"
      }
    }
  ]
}
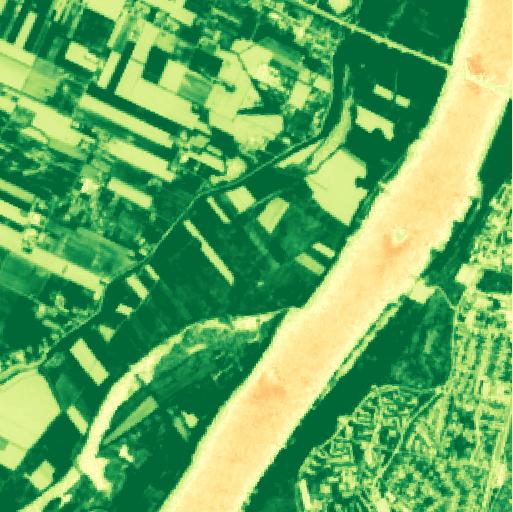
Contents of file 63ca5877-117e-497f-9a49-a264b2a3ca23.tiff
Legend is in section RGB Output.
Capabilities
Input
This block has such input_capabilities:
"input_capabilities": {
  "raster": {
    "up42_standard": {
      "format": {
        "or": [
          "SAFE",
          "GTiff",
          "DIMAP"
        ]
      },
      "sensor": {"or": ["Landsat8", "Sentinel2", "SPOT", "Pleiades"]}
    }
  }
}
Warning
Please ensure that input block is listed under Supported data blocks section.
Output
This block has such output_capabilities:
"output_capabilities": {
  "raster": {
    "up42_standard": {
      "format": "GTiff",
      "dtype": {"or": ["uint8", "float"]},
      "resolution": ">"
    },
    "custom": {
      "bands": [
        "savi"
      ]
    }
  }
}
If colormap is set to id then output type is float. Otherwise it’s uint8.
Colormap
SAVI is always in \([-1, 1]\) range. There are two possible output types: RGB output and raw output.
The output type is controlled with colormap parameter (see Colormap).
RGB Output
We can visualize SAVI as RGB GeoTIFF file. Colormap assigns color to each possible index value.
A legend for commonly used color maps is in the figure below.
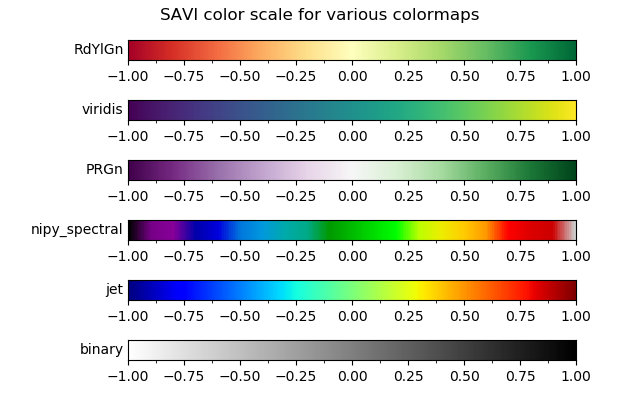
Commonly used colormaps
This block supports any predefined Matplotlib colormaps.
Set colormap parameter to requested colormap name (see Colormap).
Raw Output
It is possible to get raw output, i.e. single band GeoTIFF file with float32 matrix containing SAVI values.
Set colormap parameter to id (see Colormap).
{
  "colormap": "id",
  "L": 0.3
  "satellite": "SPOT 6/7 Download"
}
Such files can be manually colorized in QGIS with singleband pseudocolor. It is possible to read SAVI value for particular pixel with Identify Features tool.
Other usage of such files is further processing in Python or as an input for other up42 processing blocks.